Use this building block to embed external content on your Graphics Editor (e.g., videos, countdown widget, maps, among others).
Be Aware
The External Content Element only accepts external resources served over HTTPS protocol.
How does it work?
The External Content renders a page or embeddable content from an URL
Obtain the URL you want to embed:
Instagram public posts URL (does not support live or IGTV)
Google Maps
Weather widgets
Countdown
Waze
Any content with an URL.
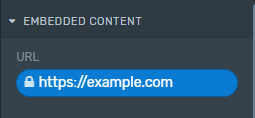
Paste the URL on the Embedded Content section on the Inspector.
On the Canvas you will see rendered the external content you just have added. You can then use it as an element between the rest of your Graphics Package.
Take into account that, while the Producer can control when the element is displayed via overlays, there isn't a way to control / operate the embedded content itself from the remote control because it's coming from another site.
The only way to interact with content inside the Embedded element is by clicking directly in the output window.
Bear in mind
There are some sites that do not allow to be embedded, e.g., Google. If the content you want to embed is hosted by you, check with your IT team if it has all the necessary permissions to be embedded.
Properties
Position and Size
Position and Size
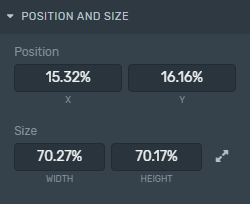
Position: Change the External Content element position inside the Canvas according to the X and Y axis (in percentage relative to the configured screen resolution).
Size: Change the element size inside the Canvas according to its width and height (in percentage relative to the configured screen resolution).
Borders
Borders
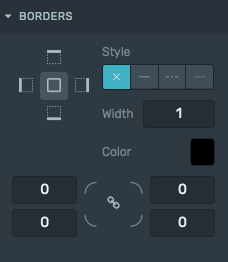
Style: Defines the sides and style of the border.
Width: Defines how wide the border will be.
Color: Choose a color for the border.
Radius: Increasing this number will round the corners of the rectangle.
Learn how to change these properties specific to borders by clicking here.
Inspirational Use Cases
Weather
Weather
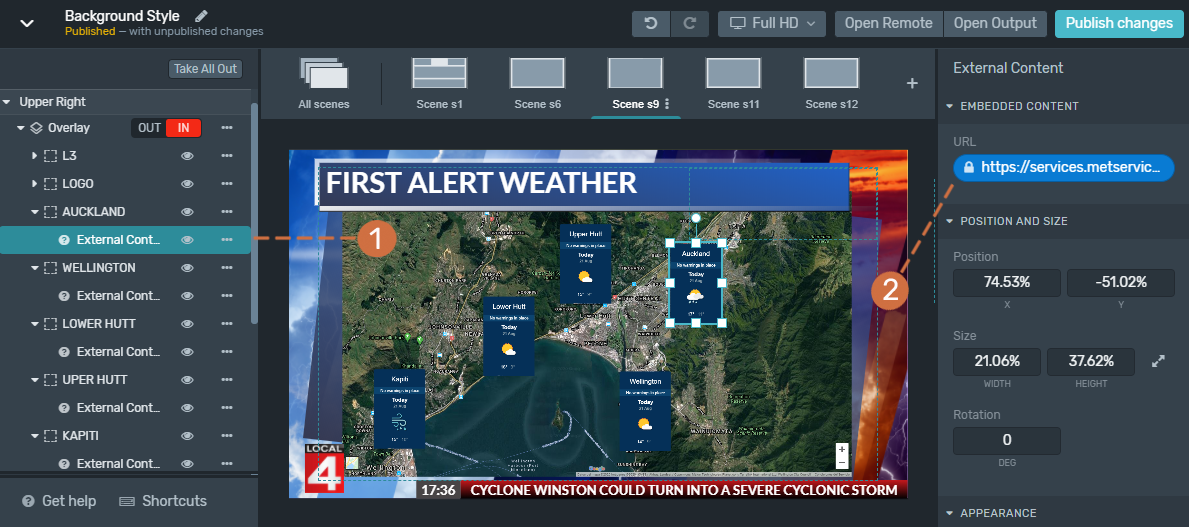
1. Select the External Content element.
2. Get the link and paste into the URL field from the Inspector.
Building the example
In the example above:
We used the MetService Website Weather Widget https://www.metservice.com/
There is a selection of layouts, sizes and colors to choose from.
The widget shows the forecast for different New Zealand cities.
We copied the embed code and it was inserted into the Graphics as an External Content.
Then we just duplicated the element by copy-pasting it and changed the URL.
Also we got the embed URL from Google Maps (https://www.google.com/maps) to show the full screen map.
Live Traffic Map
Live Traffic Map
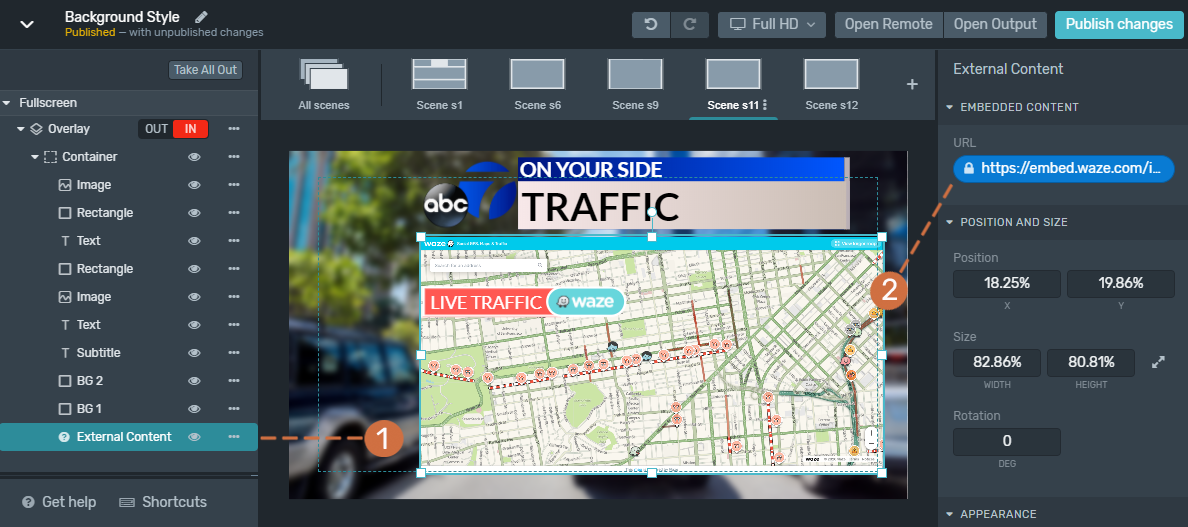
1. Select the External Content element.
2. Get the link and paste into the URL field from the Inspector.
Building the example
In this example:
We are showing the live traffic provided by Waze.
Set a location.
Get embeddable actionable location info to add as an External Content on Graphics.
Statistics Content
Statistics Content
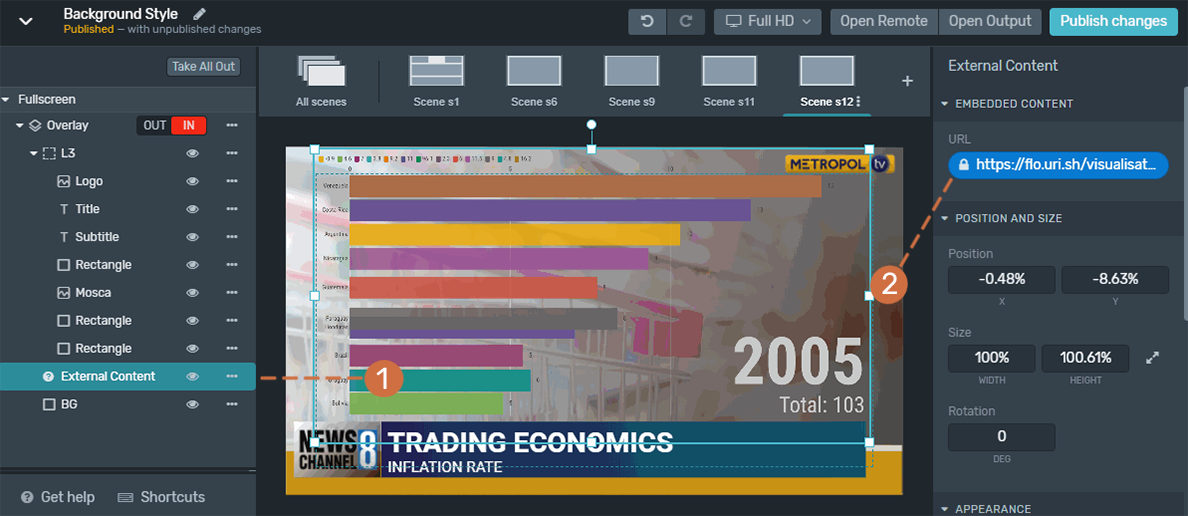
1. Select the External Content element.
2. Get the link and paste into the URL field from the Inspector.
Building the example
In the example above:
We are showing a full screen statistics content with an inflation rate.
In this example we built a chart with https://flourish.studio/
Quickly turn your spreadsheets into online charts, maps and interactive stories.
Get the embed URL to add as an External Content on Graphics.
Countdown
Countdown
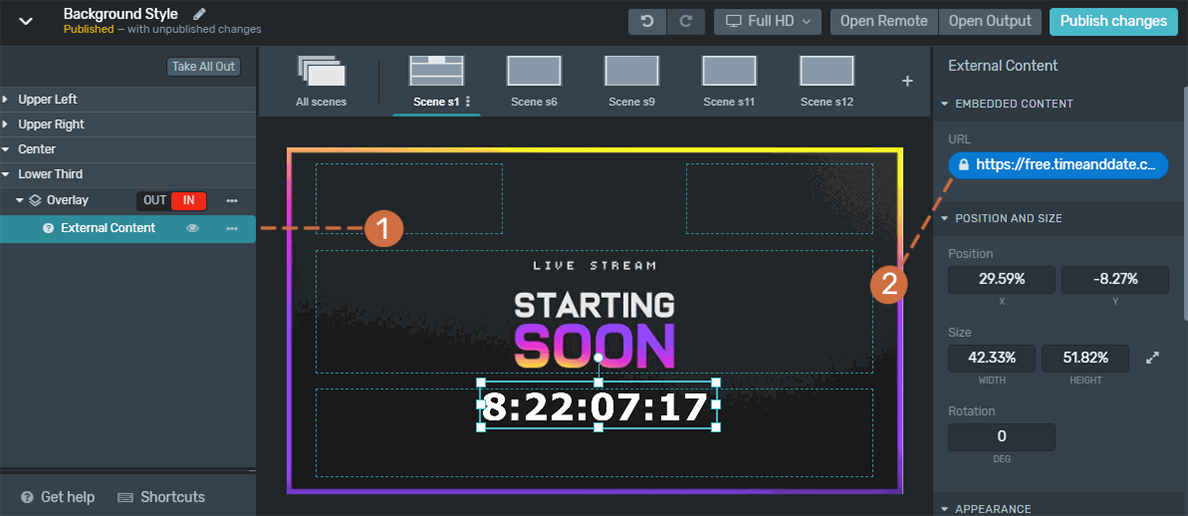
1. Select the External Content element.
2. Get the link and paste into the URL field from the Inspector.
Building the example
In the example above:
We are showing a countdown timer that can help you count down to any special event, such as a live streaming.
The countdown that we use for this example is a transparent file we built on https://www.timeanddate.com/
Once you have been setting and customize your own countdown, get the embed URL to add as an External Content on Graphics.

