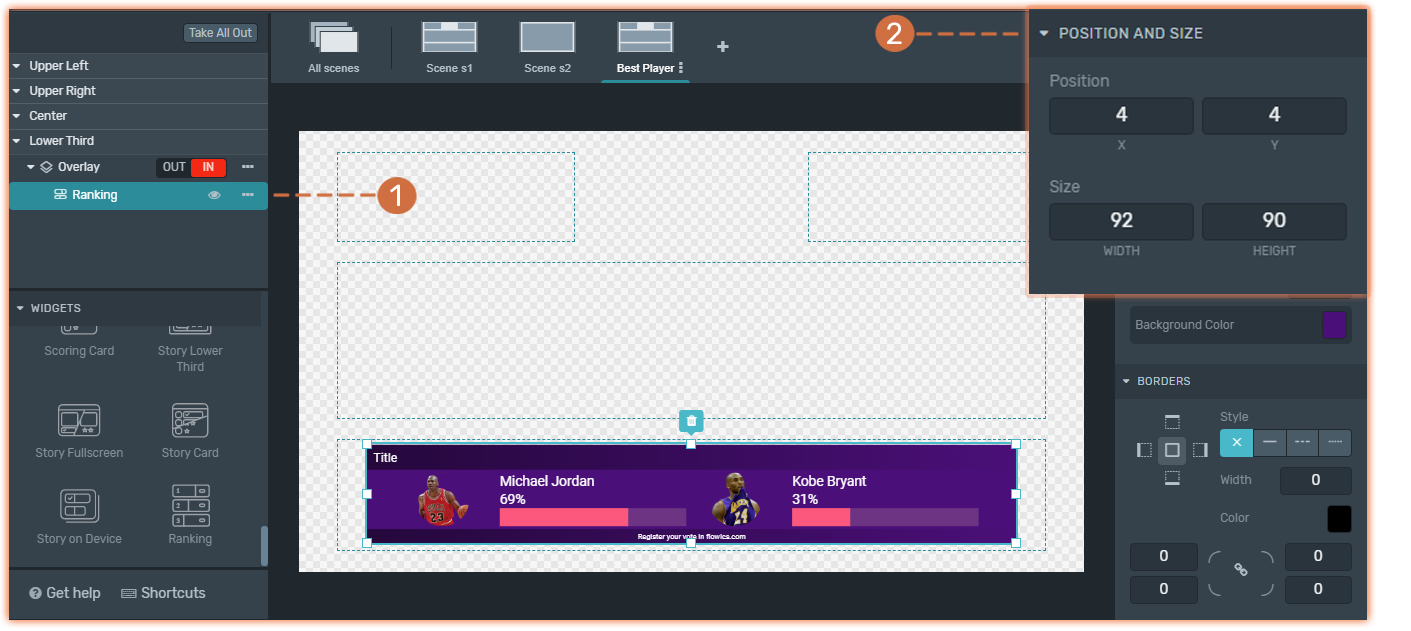
The Ranking Widget is used for displaying on-air Flows comparison or battle results.
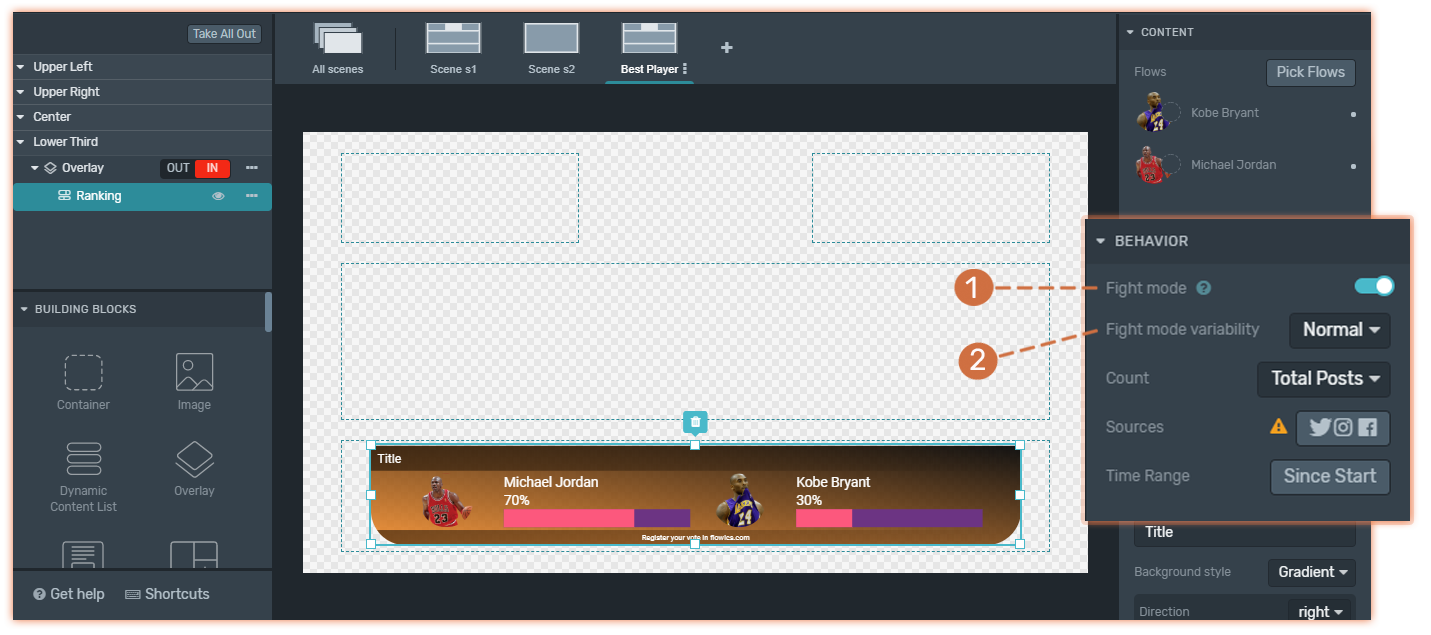
One of the Key Features of this Widget is that counts with Fight Mode.
Before setting up a Ranking Widget for Graphics you should:
1. Create as many Flows as options you wish to compare.
To learn how to add Elements to your Visualization, click here.
Working with a Ranking Widget
1. Pick Flows
(1) Click on the Ranking Widget in the tree.
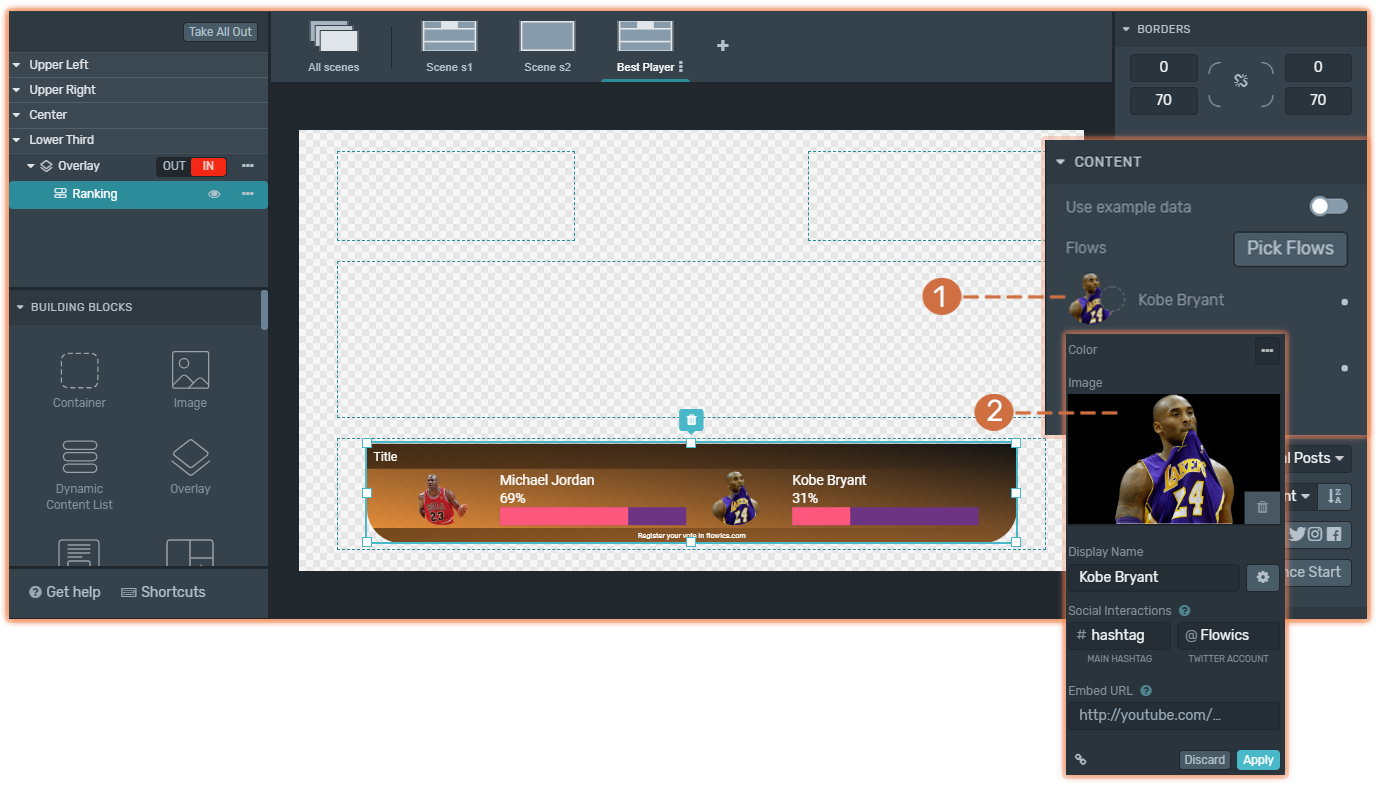
(2) You will see listed your currently created Flows in that experience. Pick the one you want to use.
2. Designing
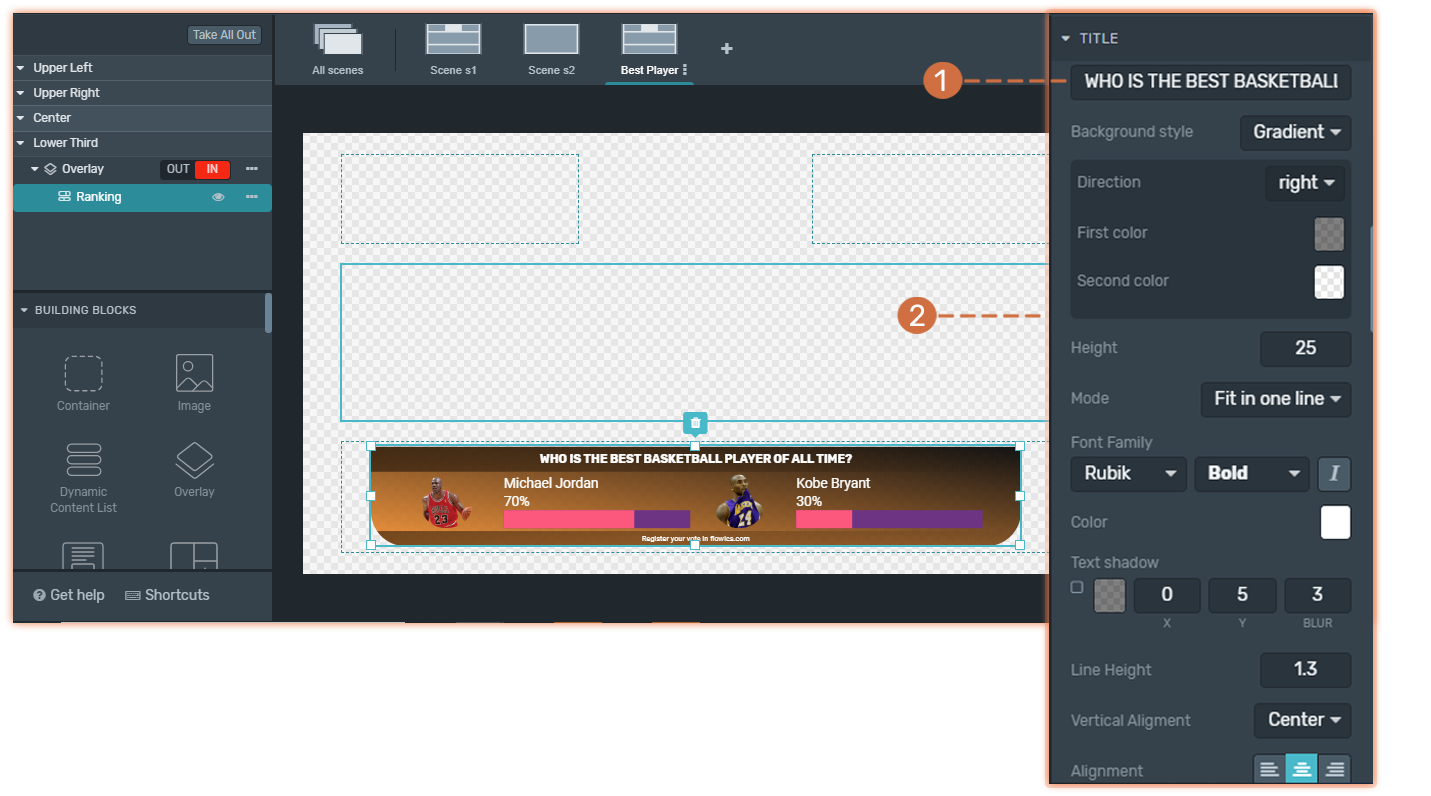
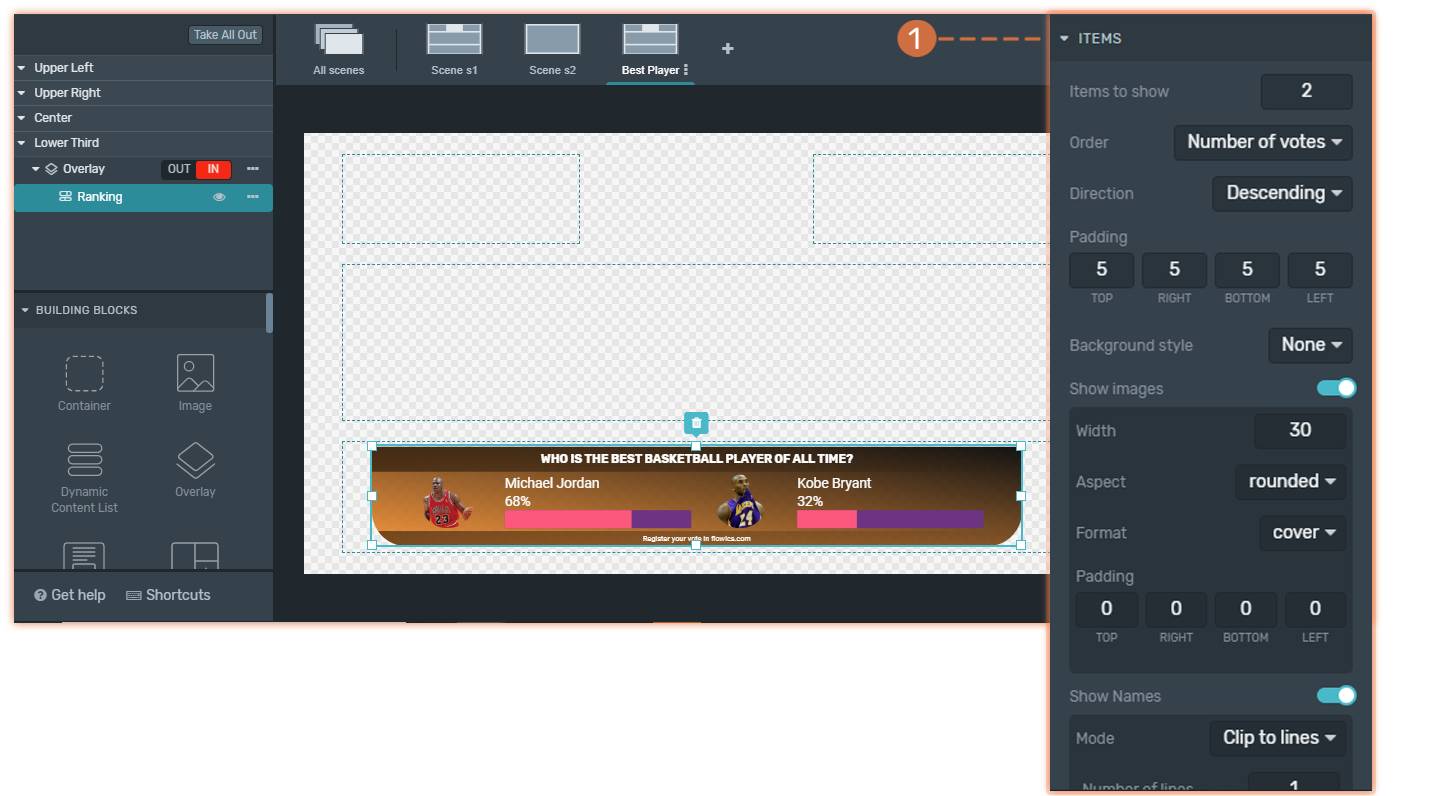
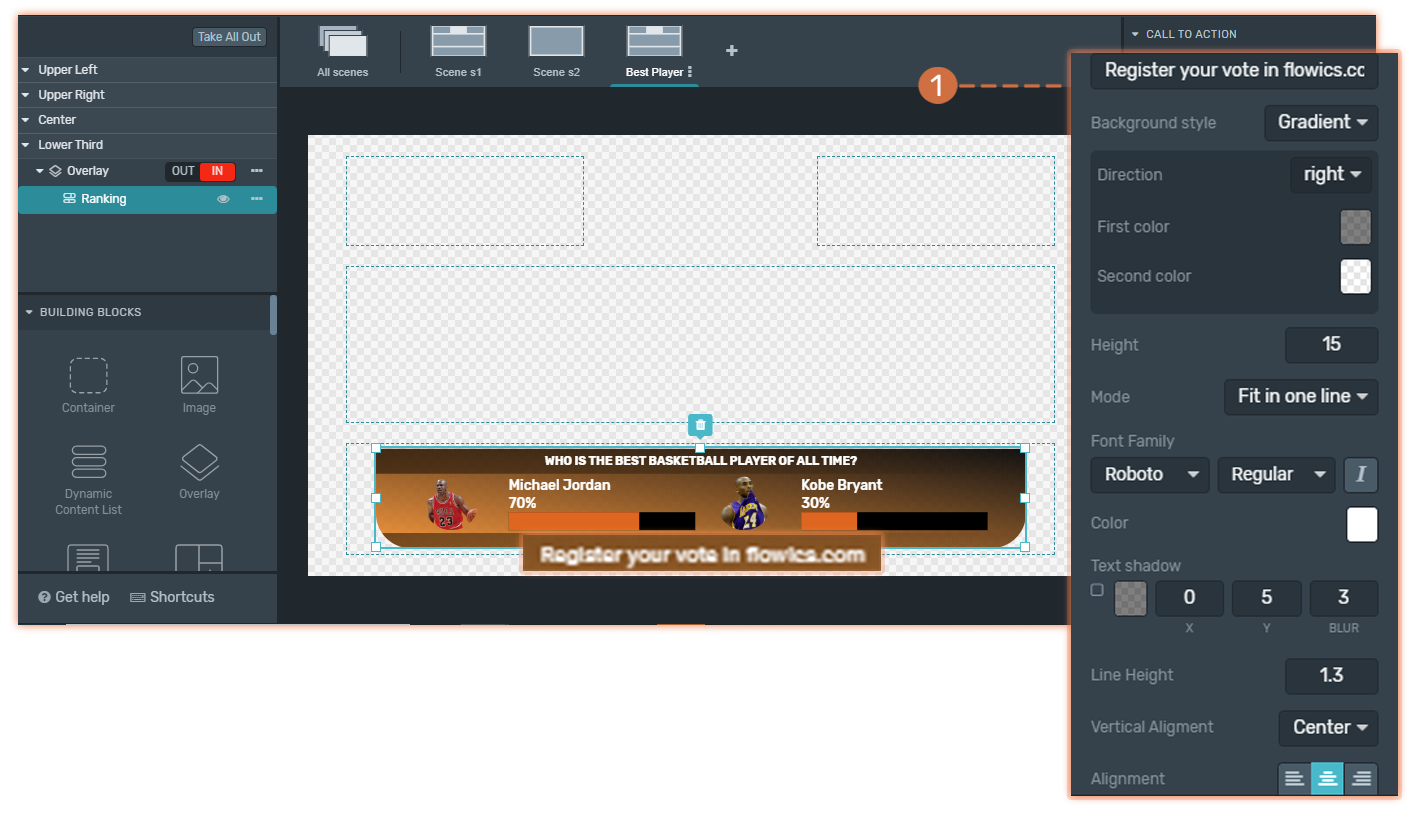
In the Inspector, right-sidebar, you will be able to change the following properties:
Background Style
Background Style
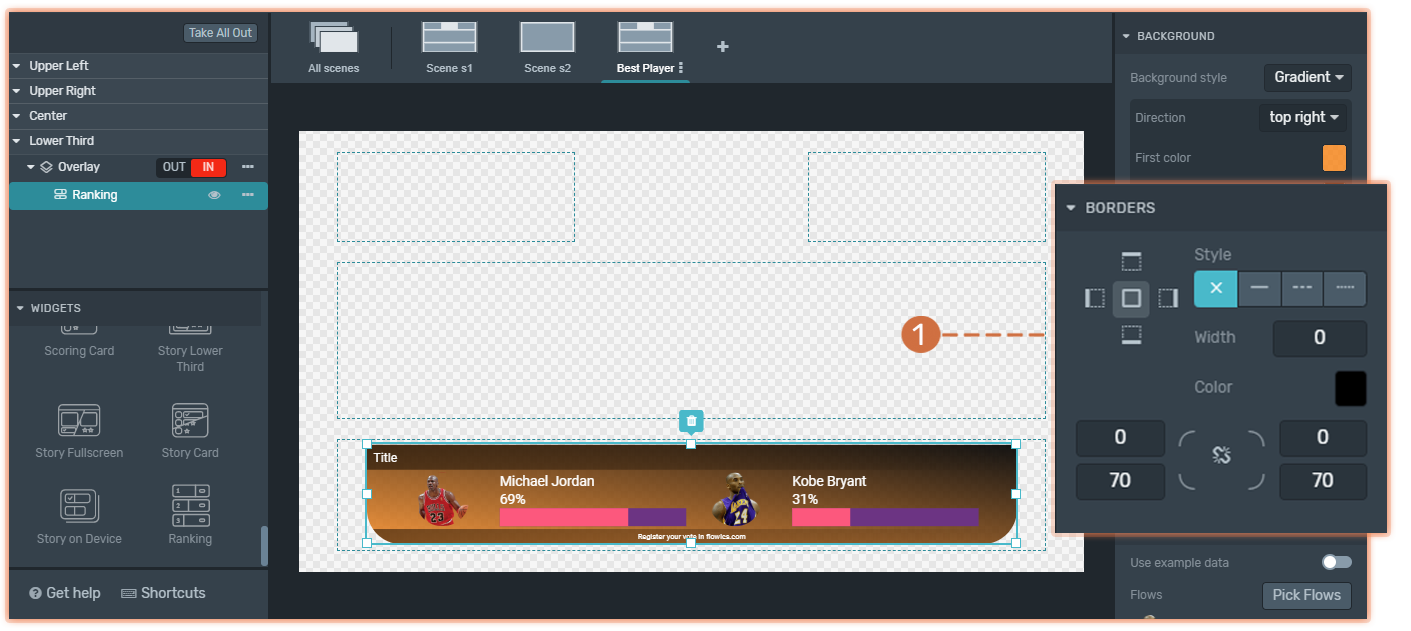
Within the Inspector, you can modify the element backgrounds look and feel. It can be a solid color, a gradient, or an image.
Learn how to implement these properties specific to backgrounds by clicking here.
Show Images
(1) You can choose either to show the flow images or not. You may also re-design them with your own look and feel.
Show Names
(2) You can choose either to show the flow names or not. You may also re-design them with your own look and feel.
Show Percentages
(3) You can choose either to show the Ranking percentages or not. You may also re-design them with your own look and feel.
Show Progress Bar
(4) You can choose either to show the Ranking Progress Bar or not. You may also re-design it with your own look and feel.
3. Remote Control
With the Remote Control, you can Trigger IN or OUT the Ranking Widget while working On-air. Take into account that changes made to the visualization with the remote control will only affect the live visualization.


