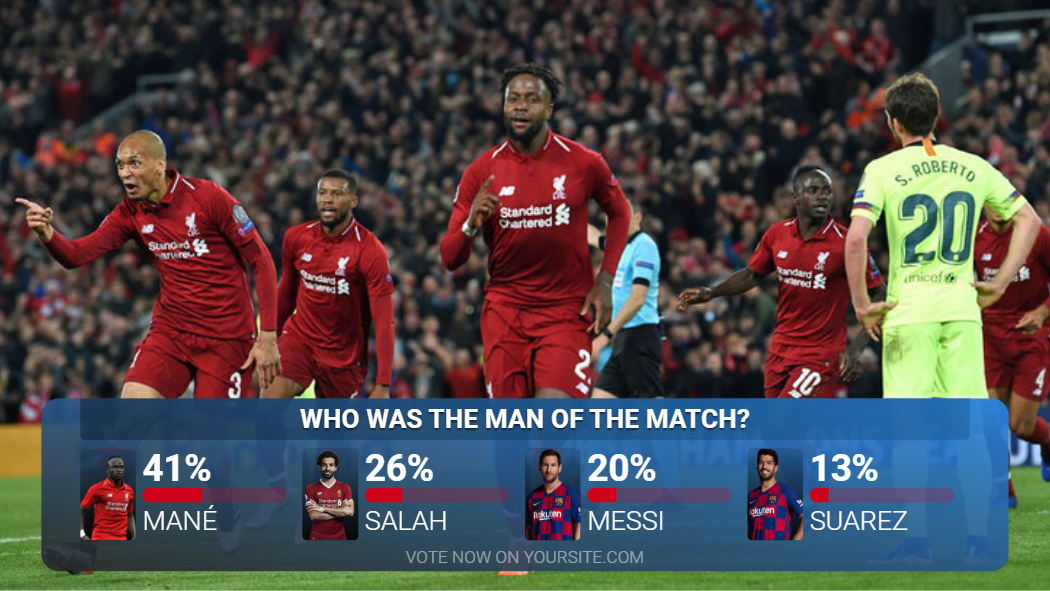
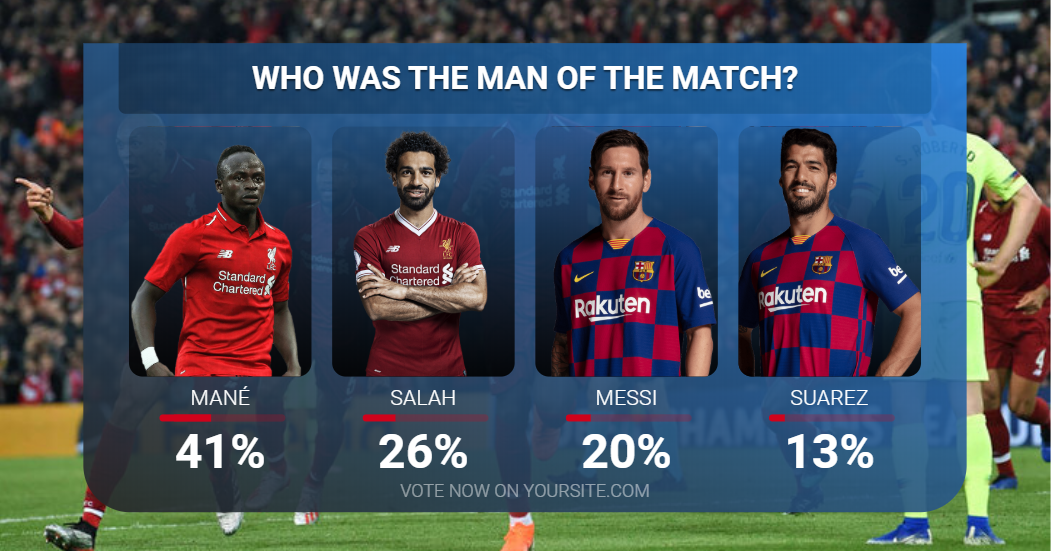
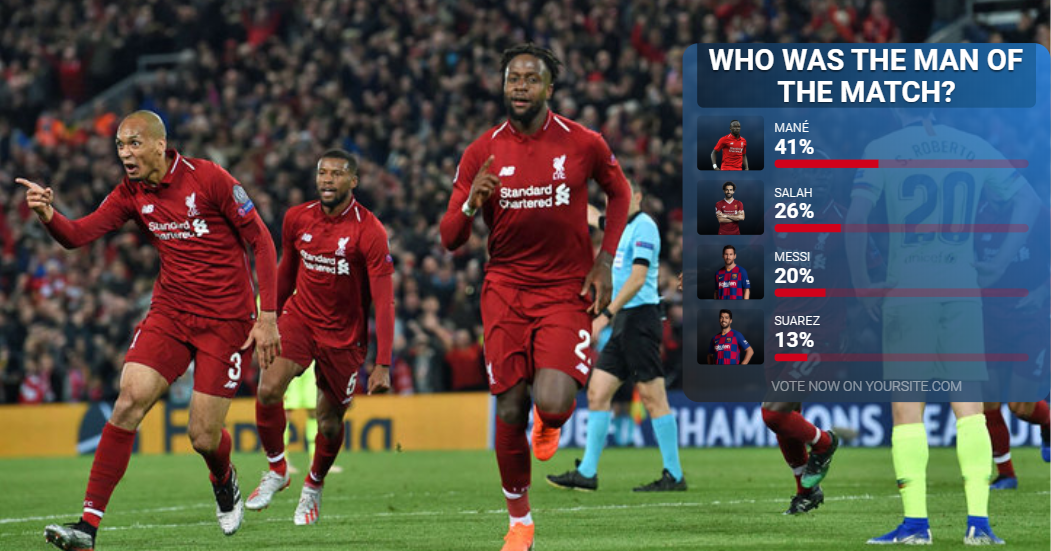
This Widget is used to build customize graphics for displaying on-air the results of your Poll Mechanic during a live streaming or TV broadcast with your own look and feel.
If you are interested in building your graphics from scratch with your own layout, then we recommend using the Story Data Provider.
Before setting up a Poll Widget for Graphics you should:
1. Create a Poll Mechanic.
2. Set up your Poll Mechanic.
To learn how to add Elements to your Visualization, click here.
Layouts
Elements Tree
Name | Element Type | Connected to |
Story Provider | Story Provider | Poll Mechanic |
1.Title | Text | Question |
Options List | Dynamic Content List | Options |
Options | List | - |
2.Image Container | Container | - |
Image | Image | Image |
3.Poll Value | Text | Percentage/Count |
4.Poll Bar | Progress Bar | Percentage/Count |
Poll Bar Correct Answer | Progress Bar | Percentage/Count |
5.Label | Text | Name |
6.Footer | Text | - |
7.Header Background | Rectangle | - |
8.Gradient Background | Rectangle | - |
Elements
This Widget has the following related elements:


